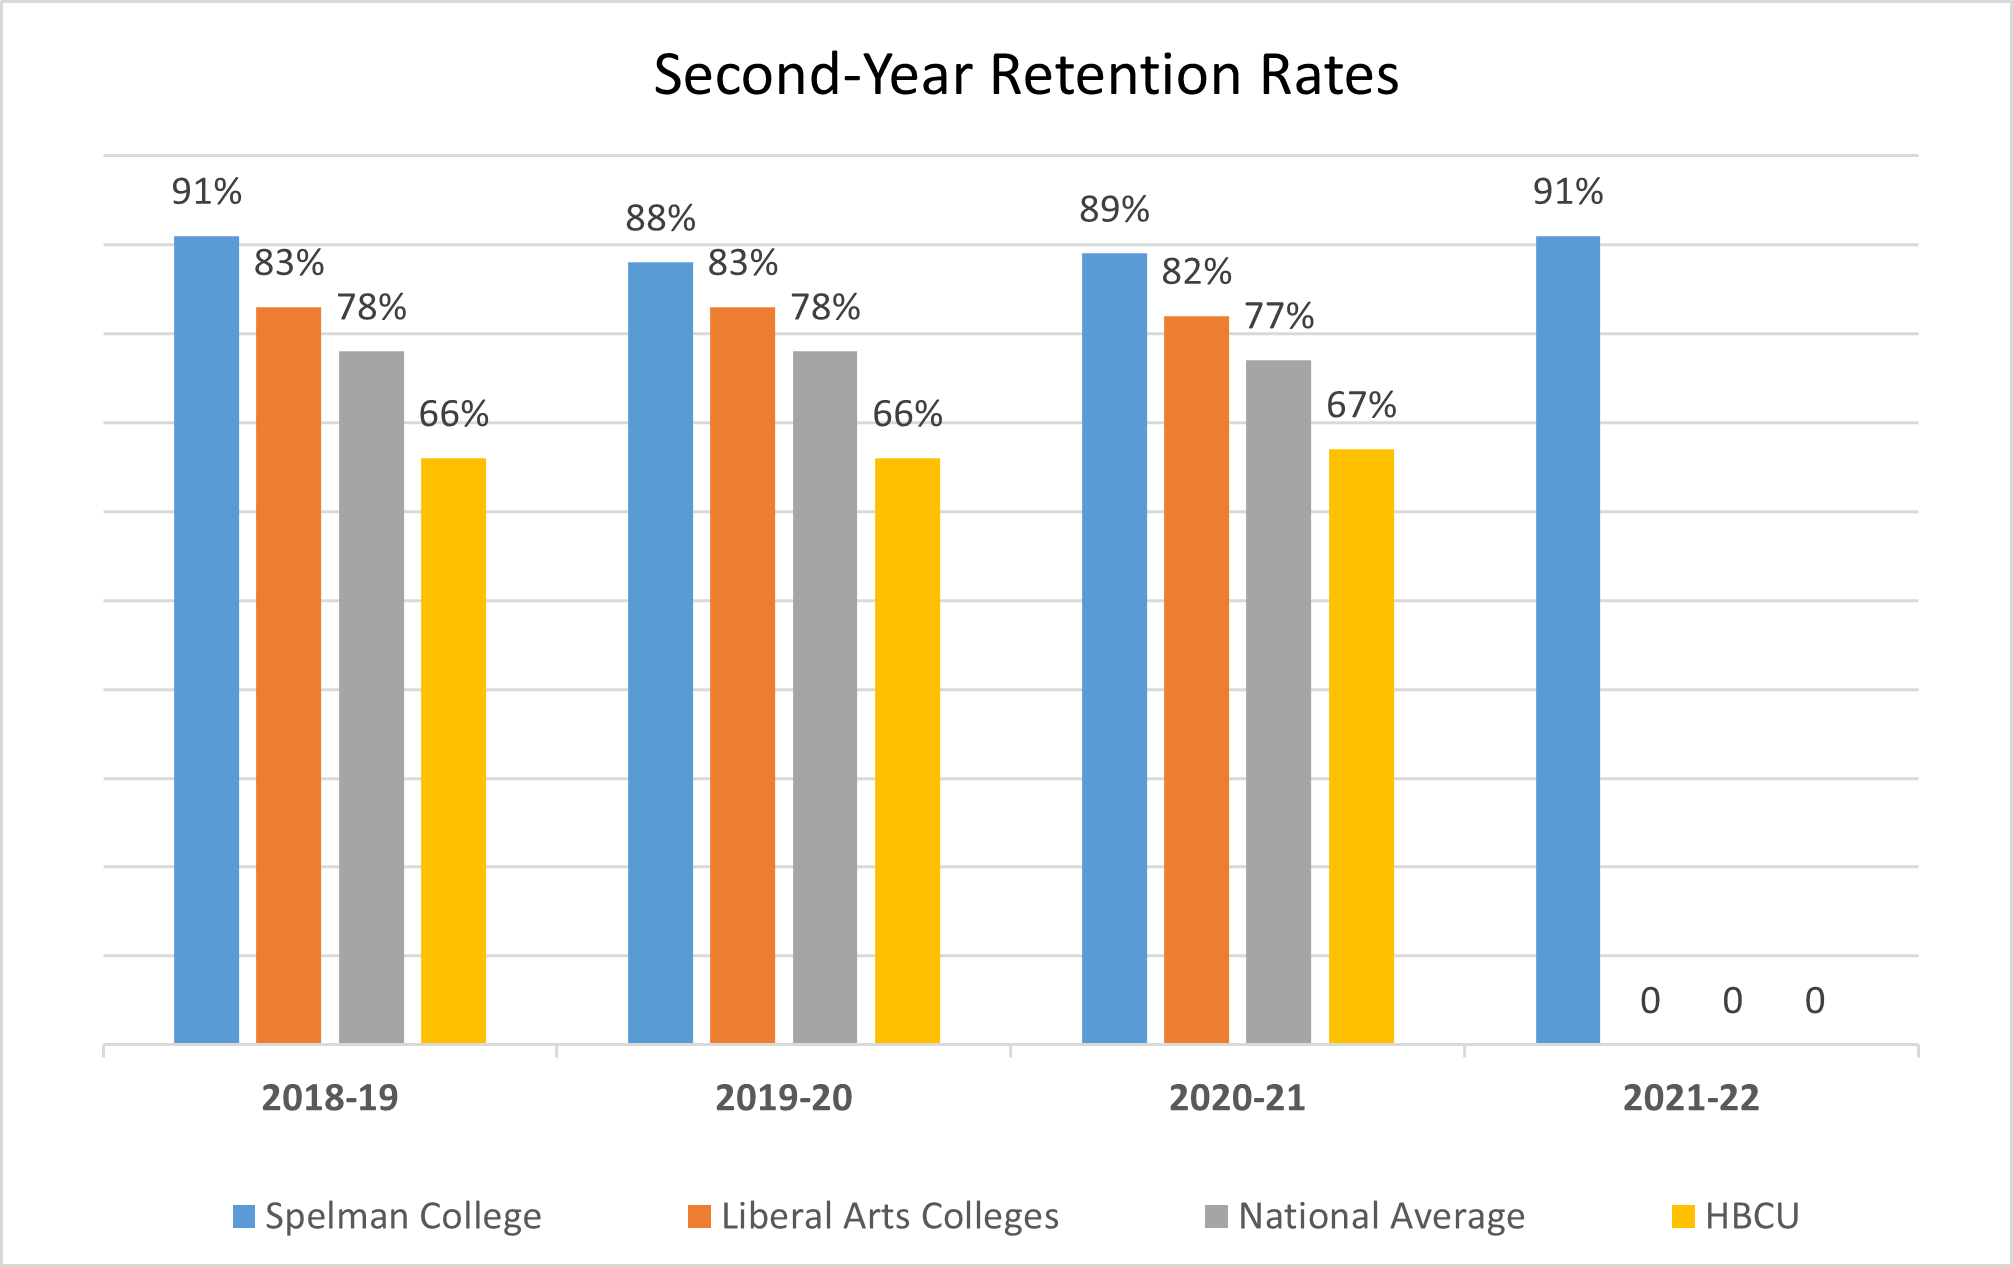
The College’s target is to exceed the national average for Second-Year Retention by a minimum of five (5) percentage points. In support of the College’s responsibility to its students and their first-year experience at Spelman College, the threshold for Second-Year Retention has been established at 85%. This ensures that the College remains committed to enhancing the student experience and thereby, retaining a majority of its first-year students.
The current Second-Year Retention Rate is 91% for Spelman College. Retention rates for the comparison group were not yet available as of the publication of this report. However, Spelman’s prior year Retention Rate of 89% outperformed those in the comparison group with a 7-point margin over Liberal Arts Colleges, 12 points over the national average, and 22 points over HBCU’s. The 2021-22 retention rate of 91% represents a steady increase in retention from the previous year and exceeds the established benchmark of 85%.
| Academic Year | Cohort | Spelman College | Liberal Arts Colleges* | National Average** | HBCU*** |
| 2018-19 | 2017 | 83% | 78% | 78% | 66% |
| 2019-20 | 2018 | 88% | 83% | 78% | 66% |
| 2020-21 | 2019 | 89% | 82% | 77% | 67% |
| 2021-22 | 2020 | 91% | n/a | n/a | n/a |
* Liberal Arts Colleges: Carnegie Classification, Baccalaureate Colleges: Arts & Sciences Focus
** National Average includes all 4-year Degree-granting, primarily baccalaureate or above Institutions
***HBCU includes all 4-year Historically Black Colleges and Universities
n/a – IPEDS data not available
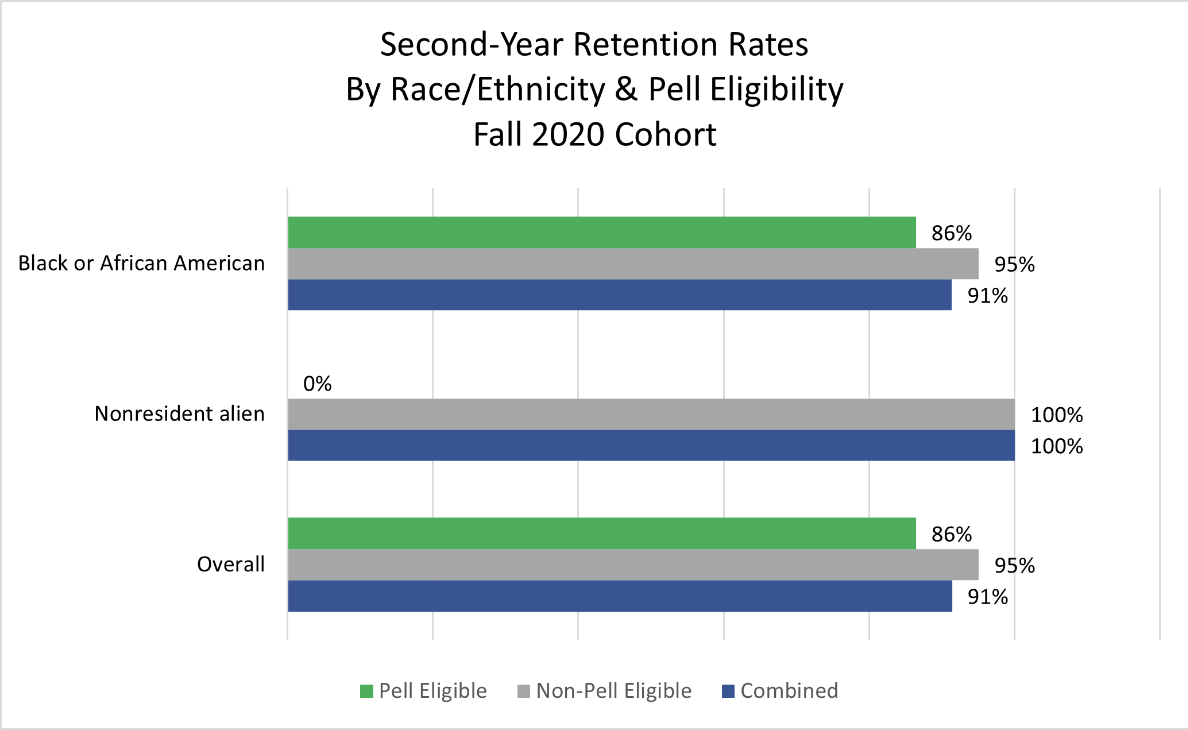
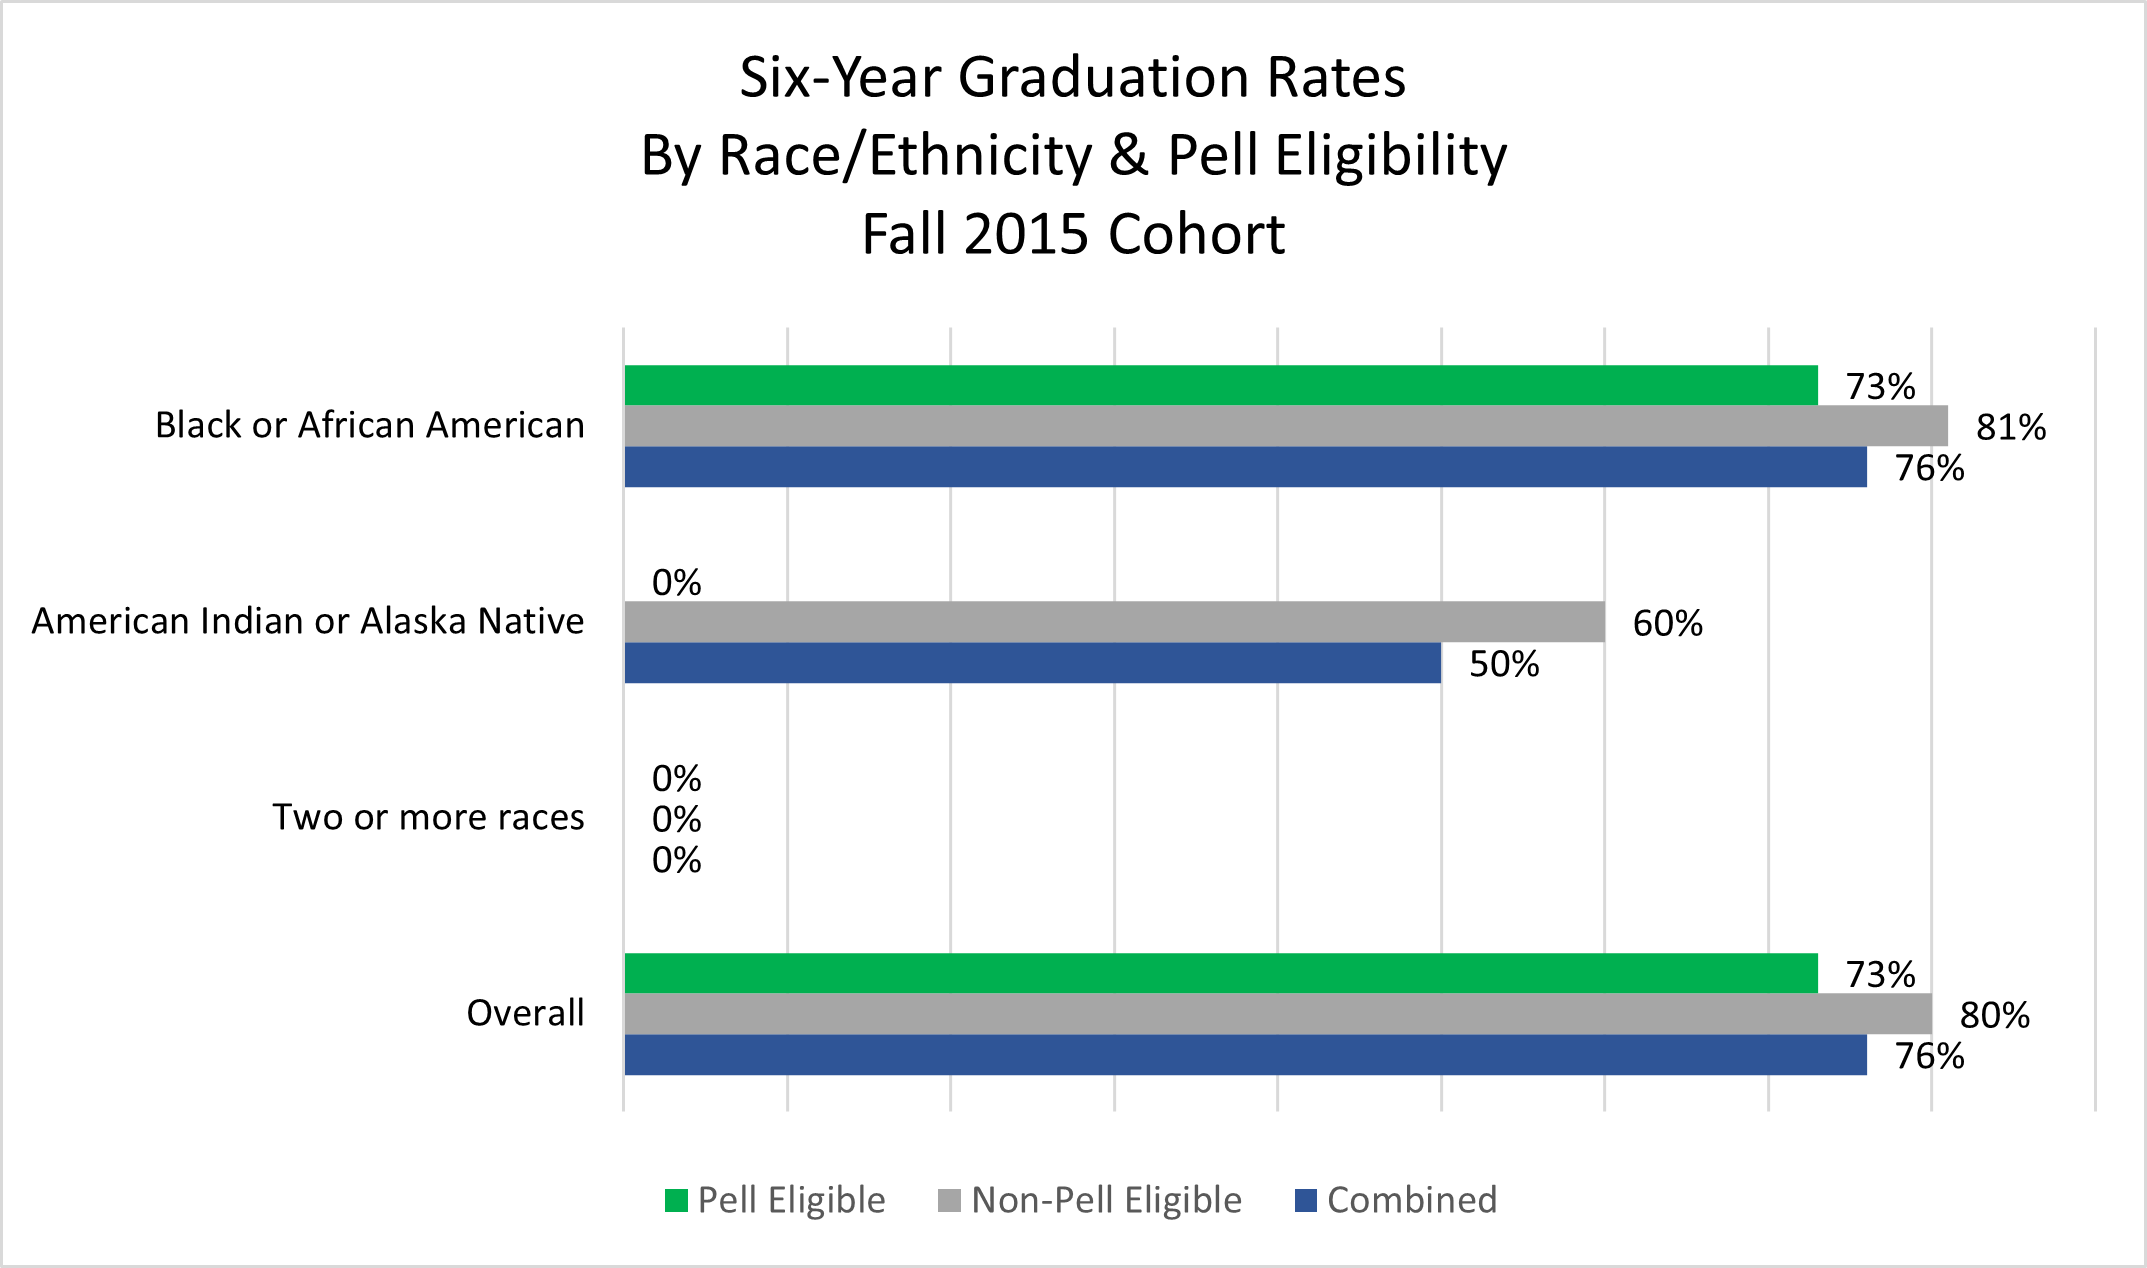
The 2021-22 Second-Year Retention Rate (91%) for Spelman College’s 2020 cohort has been further disaggregated by race/ethnicity and socioeconomic level. Pell eligibility, the most closely related variable, has been used represent socioeconomic level as shown in the chart below.
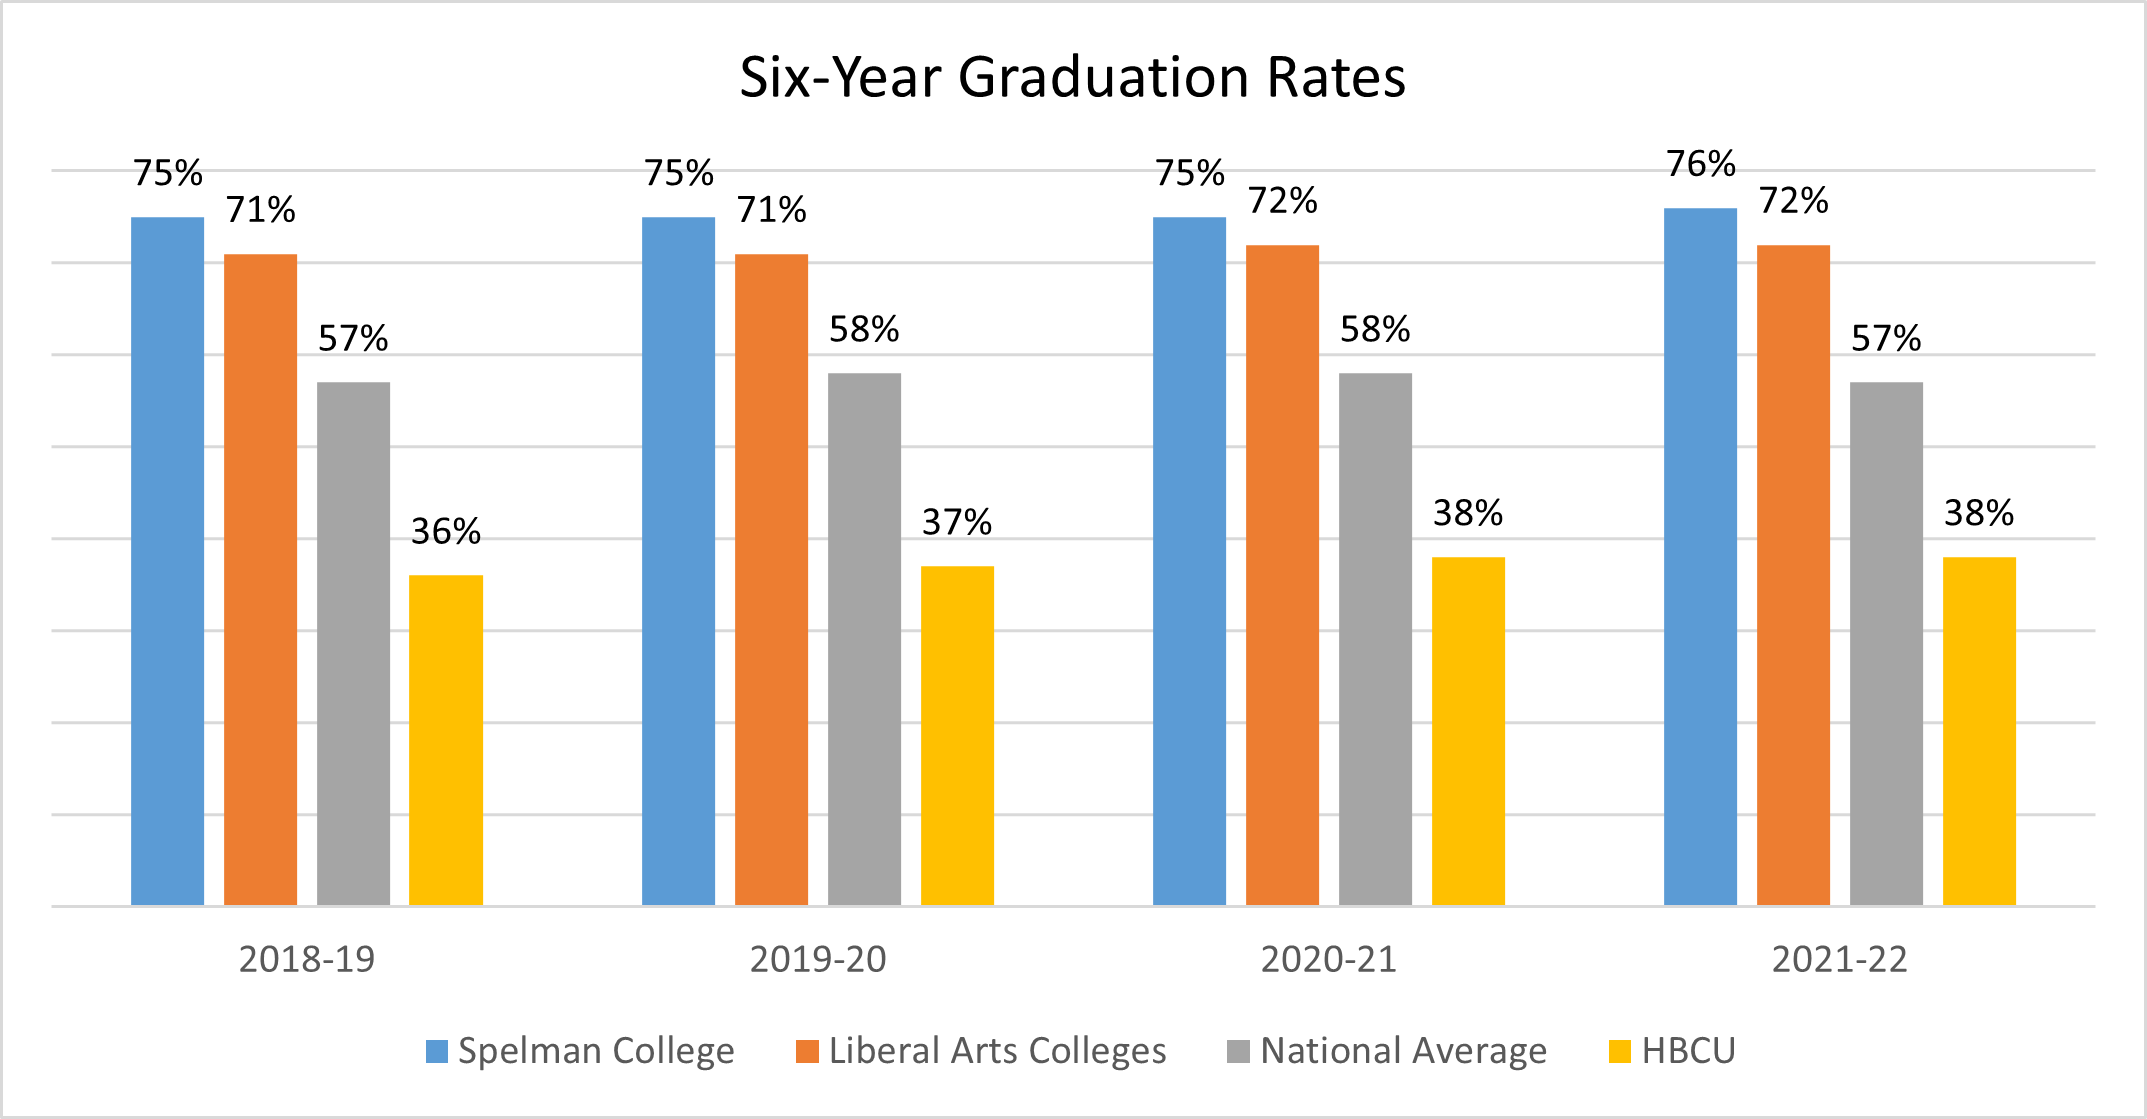
The College’s target is to exceed the national average Six-Year Graduation Rate by ten (10) percentage points. For the 2015 cohort, Spelman’s graduation rate of 76% is 19 points greater than the national average of 57%. This exceeds the target by 9 points. In addition, the Six-Year Graduation Rate for Liberal Arts Colleges is 72% -- 4 points less than Spelman’s (Table 8.1-2: Six-Year Graduation Rates). Although the College exceeded the Graduation Rates of those in the comparison group by several percentage points, it continues efforts to surpass a graduation rate threshold of 75%.
| Academic Year | Cohort | Spelman College | Liberal Arts Colleges* | National Average** | HBCU*** |
| 2018-19 | 2012 | 75% | 71% | 57% | 36% |
| 2019-20 | 2013 | 75% | 71% | 58% | 37% |
| 2020-21 | 2014 | 75% | 72% | 58% | 38% |
| 2021-22 | 2015 | 76% | 72% | 57% | 38% |
*Liberal Arts Colleges: Carnegie Classification, Baccalaureate Colleges: Arts and Sciences Focus
**National Average includes all 4-year Degree-granting, primarily baccalaureate or above Institutions
***HBCU includes all 4-year Historically Black Colleges and Universities
The 2021-22 Six-Year Graduation Rate for Spelman College’s 2015 cohort has been further disaggregated by race/ethnicity and socioeconomic level. Pell eligibility, the most closely related variable, has been used represent socioeconomic level as shown in the chart below.
Spelman College students pursuing teacher certification routinely take the state licensing examination, the Georgia Assessments for the Certification of Educators (GACE). The College’s benchmark for these students is a pass rate of at least 85%, which is five (5) percentage points greater than the teacher accreditation standard. The College's Education Department maintains statistics on teacher certification pass rates, which have averaged nearly 97% since the 2012-13 academic year for students taking the GACE exam. The most recent GACE report from the 2021-22 academic year indicates a pass rate of 100% (Table 8.1-3: GACE Passing Rates). These data indicate student performance on the GACE exam far surpasses the established benchmark.
Table 8.1-3: GACE Passing Rates
| Academic Year | Passing Rate |
| 2018-19 | 100% |
| 2019-20 | 100% |
| 2020-21 | 100% |
| 2021-22 | 100% |
As of July 2020, the Education Teacher Performance Assessment (edTPA) exam is no longer a certification requirement in Georgia as reported in previous years.
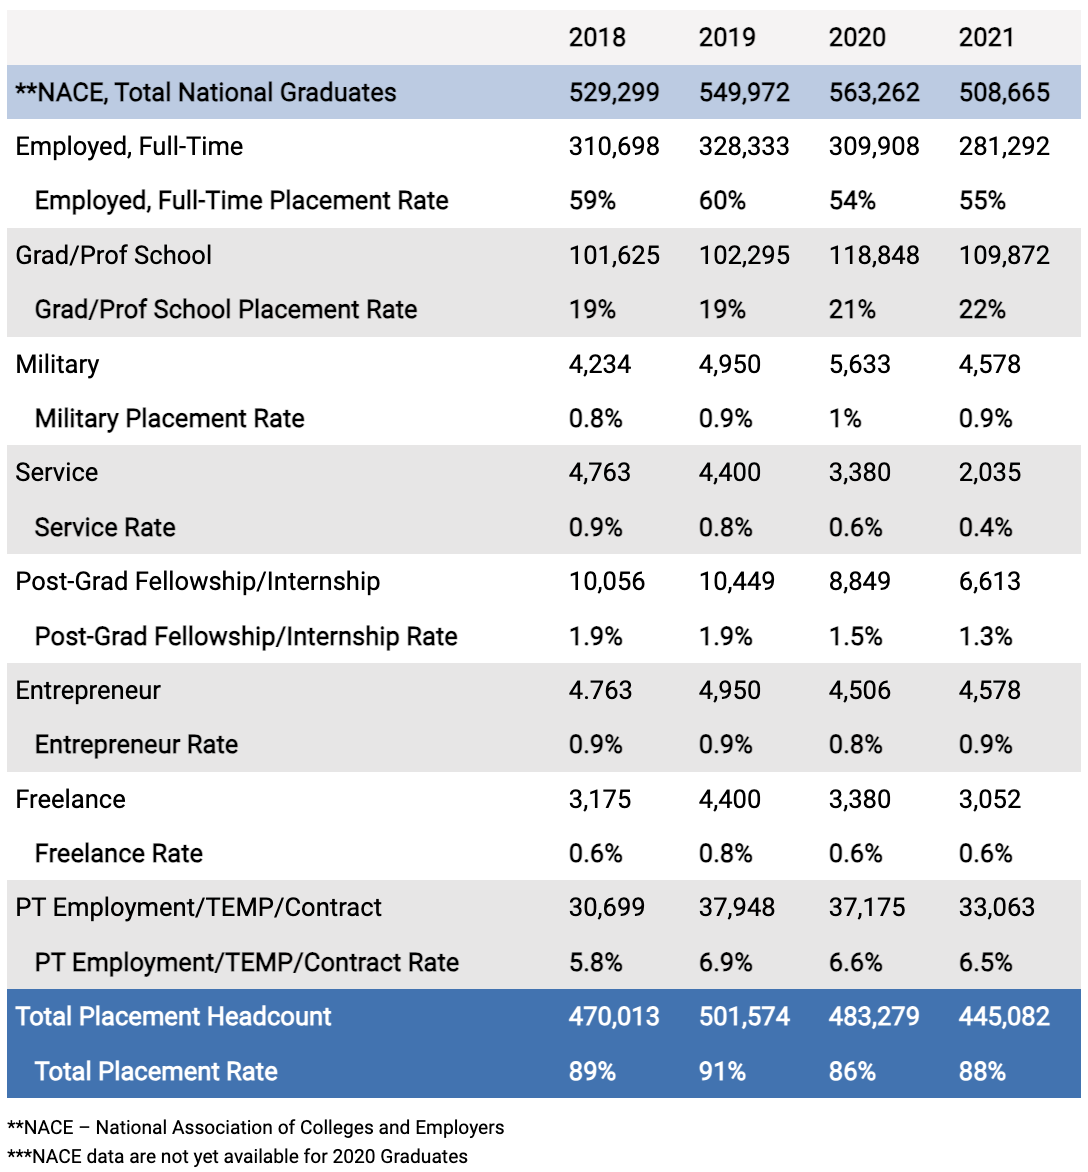
The College obtains information annually on job placement as well as graduate and professional school acceptance through the First Destination Survey administered prior to graduation by the Office of Career Planning and Development (CPD). In addition, CPD re-administers the survey six months following graduation to gather additional detailed information about employment; pursuit of graduate/professional education; and other academic or leadership opportunities post-graduation. Table 8.1-4 below gives a summary of Spelman College graduates’ placement rates subsequent to program completion. For comparison, Table 8.1-5 provides national placement rates as reported by the National Association of Colleges and Employers (NACE).
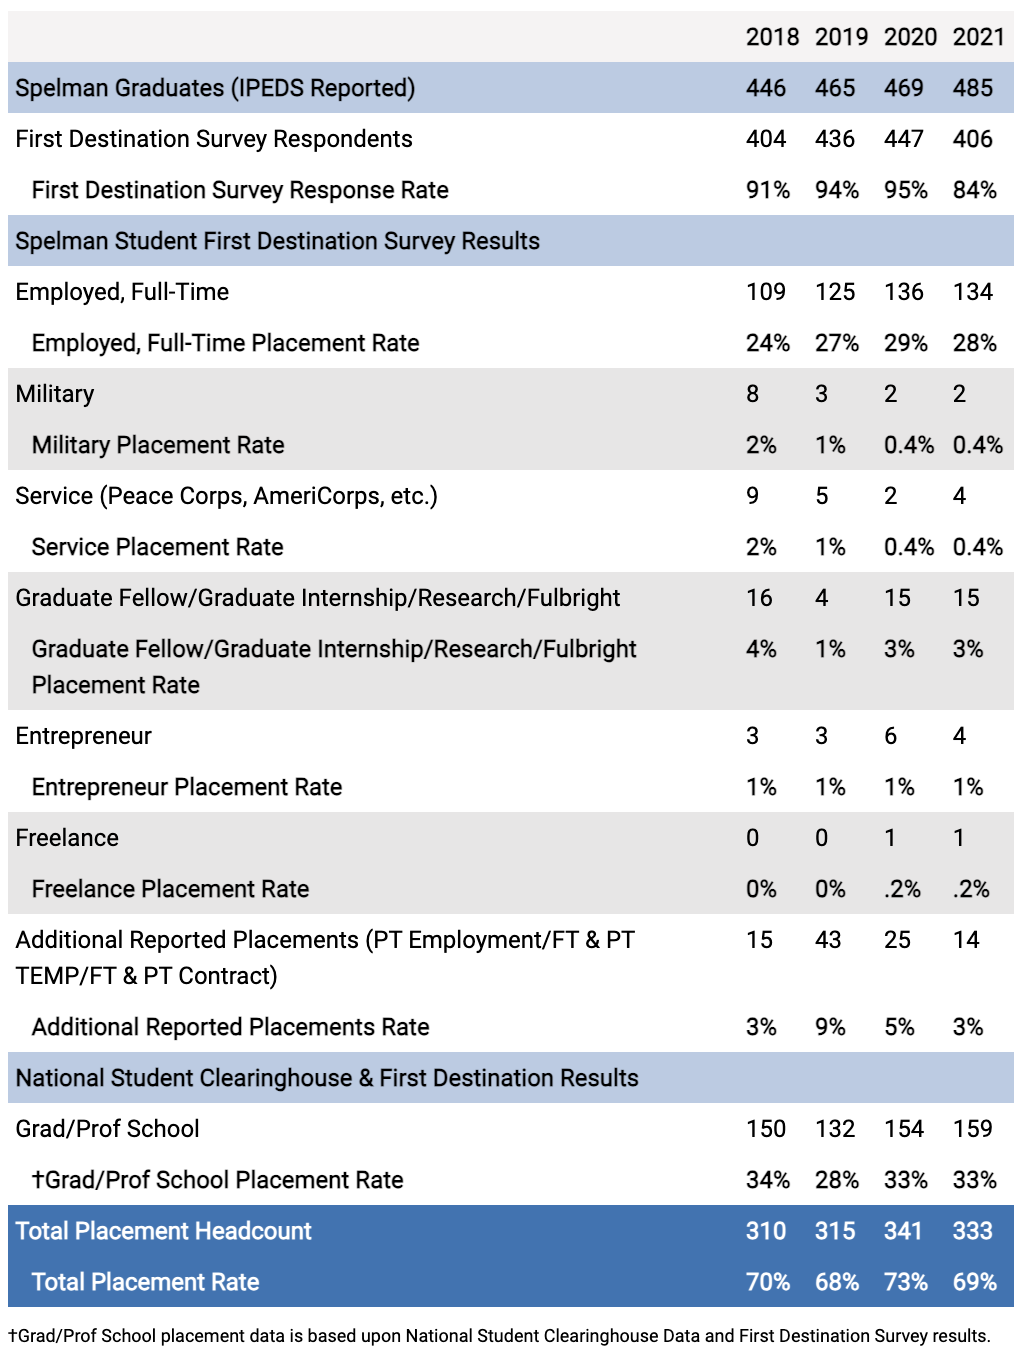
Survey results also captured participation in other post-baccalaureate opportunities (excluding full-time employment and grad/prof school), considered successful post-graduation outcomes. In 2021, 10% of Spelman graduates reported participation in other post-baccalaureate opportunities including military enlistment, Fulbright engagements, research, internships and fellowships. When combined with full-time employment and grad/prof school placements, the data show that 69% of our most recent alumnae are actively engaged in post-baccalaureate opportunities. The College has established a post-baccalaureate placement threshold of at least 75% for our graduates. Although the post-baccalaureate placement rate for the 2021 graduates is slightly less, we continue to strive for this level of achievement using various student success initiates.
The Office of Career Planning and Development (CPD) has improved its job fair offerings inviting more companies to attend on campus. CPD also works with our students to help improve their job interviewing skills. Graduate school recruitment events are hosted throughout the academic year to help students decide on the right graduate school. In addition, improvements to the data collection and verification process including gathering grad/prof school data from the National Student Clearinghouse and the First Destination Survey, have been implemented providing a more complete reporting of graduates’ post-baccalaureate endeavors. The CDP has also employed new methods in its efforts to increase the response rate and integrity of the First Destination Survey.